Transitions

Contents
The Transitions module allows you to model the benefits of a TTR strategy for an individual client.
In this module you are also able to perform super and pension platform comparisons by accessing the Product menu as well as creating a Quick SOA and PRS for pension and superannuation products.
Strategy Details
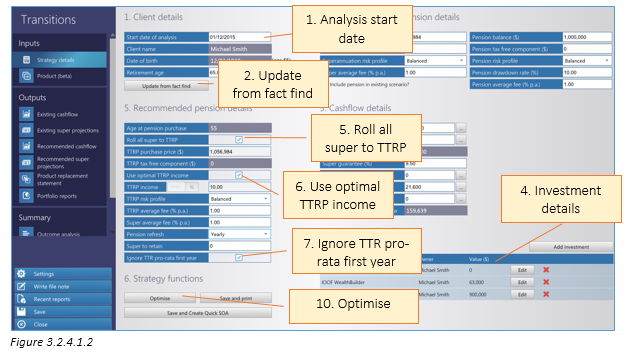
In the strategy details section you can view and make any amendments to your clients’ details to enable you to model the TTR strategy.
Entering Strategy Details
1.View/amend start date of analysis
2.Click “Update from fact find’ to ensure up to date details are used for the transitions modelling
3.View/amend existing super and pension details
4.View/amend investment details
5.Select if to roll all super to TTRP
6.Select if to use optimal TTRP income or enter manually
7.Amend/enter fees
8.Select pension refresh frequency
9.Select if ignoring first year pro-rata calculation
10.Click “Optimise”
11.Click to “Save and Create quick SOA” if required
Product
In the product section you can utilise the super and pension platform comparisons in the same manner as in the Super to Super and Pension to Pension modules. For more information on how to enter product comparisons, access the Product section of this document.
Outputs
In the outputs menus you are able to view projections in a table format for:
❄Existing cashflow
❄Existing super projections
❄Recommended cashflow
❄Recommended super projections
In the outputs section you can also view:
❄Product replacement statement
❄Portfolio reports
Summary
The summary menu shows an outcome analysis for TTRP, comparing the existing scenario with the recommended.
Outcome Analysis
The Outcome Analysis shows a summary of the existing and recommended outcomes of a TTRP in average per financial year.
Taxation Analysis Strategy Details
The Taxation analysis menu shows a projection table of the total tax analysis for both personal tax and super earnings tax for existing and recommended scenarios per financial year.
Implementation
The implementation menu shows a summary of the concessional and non-concessional contributions per financial year along with a graph showing the projection net income for existing and alternative scenarios.